---
title: Monitor instances
description: Export metrics, collect them, visualize them.
date: 2024-05-17 07:00:00+0000
image: chris-yang-1tnS_BVy9Jk-unsplash.jpg
categories:
- Nix
- Guide
- Sysadmin
- Monitoring
tags:
- Nix
- Nginx
- Prometheus
- Exporters
- Monitoring
- Docker compose
draft: false
writingTime: "20m"
---
# Monitoring
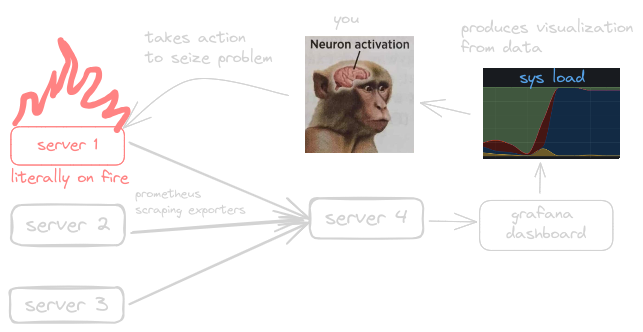
Monitoring your instances allow you to keep track of servers load and its health overtime. Even looking at the stats once a day can make a huge difference as it allows you to prevent catastrophic disasters before they even happen.
I have been monitoring my servers with this method for years and I had many cases I was grateful for setting it all up.
In this small article I have included two guides to set these services up. First is with [NixOs](#nixos) and I also explain with [docker-compose](#docker-compose) but it's very sore as the main focus of this article is NixOS.

**Prometheus**
Prometheus is an open-source monitoring system. It helps to track, collect, and analyze
metrics from various applications and infrastructure components. It collects metrics from other software called _exporters_ that server a HTTP endpoint that return data in the prometheus data format.
Here is an example from `node-exporter`
```nix
# curl http://localhost:9100
# HELP node_cpu_seconds_total Seconds the CPUs spent in each mode.
# TYPE node_cpu_seconds_total counter
node_cpu_seconds_total{cpu="0",mode="idle"} 2.54196405e+06
node_cpu_seconds_total{cpu="0",mode="iowait"} 4213.44
node_cpu_seconds_total{cpu="0",mode="irq"} 0
node_cpu_seconds_total{cpu="0",mode="nice"} 0.06
node_cpu_seconds_total{cpu="0",mode="softirq"} 743.4
...
```
**Grafana**
Grafana is an open-source data visualization and monitoring platform. It has hundreds of features embedded that can help you query from data sources like Prometheus, InfluxDB, MySQL and so on...
## NixOs
Nix makes it trivial to set up these services, as there are already predefined options for it in nixpkgs. I will give you example configuration files below that you can just copy and paste.
I have a guide on [remote deployment](/p/remote-deployments-on-nixos/) for NixOs, below you can see an example on a folder structure you can use to deploy the services.
{{< filetree/container >}}
{{< filetree/folder name="server1" state="closed" >}}
{{< filetree/folder name="services" state="closed" >}}
{{< filetree/file name="some-service.nix" >}}
{{< filetree/folder name="monitoring" state="closed" >}}
{{< filetree/file name="prometheus.nix" >}}
{{< filetree/file name="grafana.nix" >}}
{{< filetree/folder name="exporters" state="closed" >}}
{{< filetree/file name="node.nix" >}}
{{< filetree/file name="smartctl.nix" >}}
{{< /filetree/folder >}}
{{< /filetree/folder >}}
{{< /filetree/folder >}}
{{< filetree/file name="configuration.nix" >}}
{{< filetree/file name="flake.nix" >}}
{{< filetree/file name="flake.lock" >}}
{{< /filetree/folder >}}
{{< /filetree/container >}}
### Exporters
First is node-exporter. It exports all kind of system metrics ranging from cpu usage, load average and even systemd service count.
#### Node-exporter
```nix
# /services/monitoring/exporters/node.nix
{ pkgs, ... }: {
services.prometheus.exporters.node = {
enable = true;
#port = 9001; #default is 9100
enabledCollectors = [ "systemd" ];
};
}
```
#### Smartctl
Smartctl is a tool included in the smartmontools package. It is a collection of monitoring tools for hard-drives, SSDs and filesystems.
This exporter enables you to check up on the health of your drive(s). And it will also give you a wall notifications if one of your drives has a bad sector(s), which mainly suggests it's dying off.
```nix
# /services/monitoring/exporters/smartctl.nix
{ pkgs, ... }: {
# exporter
services.prometheus.exporters.smartctl = {
enable = true;
devices = [ "/dev/sda" ];
};
# for wall notifications
services.smartd = {
enable = true;
notifications.wall.enable = true;
devices = [
{
device = "/dev/sda";
}
];
};
}
```
If you happen to have other drives you can just use `lsblk` to check their paths
```bash
nix-shell -p util-linux --command lsblk
```
For example here is my pc's drives
```
NAME MAJ:MIN RM SIZE RO TYPE MOUNTPOINTS
sda 8:0 1 0B 0 disk
nvme1n1 259:0 0 476,9G 0 disk
├─nvme1n1p1 259:1 0 512M 0 part /boot
├─nvme1n1p2 259:2 0 467,6G 0 part
│ └─luks-bbb8e429-bee1-4b5e-8ce8-c54f5f4f29a2
│ 254:0 0 467,6G 0 crypt /nix/store
│ /
└─nvme1n1p3 259:3 0 8,8G 0 part
└─luks-f7e86dde-55a5-4306-a7c2-cf2d93c9ee0b
254:1 0 8,8G 0 crypt [SWAP]
nvme0n1 259:4 0 931,5G 0 disk /mnt/data
```
### Prometheus
Now that we have setup these two exporters we need to somehow collect their metrics.
Here is a config file for prometheus, with the scrape configs already written down.
```nix
# /services/monitoring/prometheus.nix
{pkgs, config, ... }:{
services.prometheus = {
enable = true;
scrapeConfigs = [
{
job_name = "node";
scrape_interval = "5s";
static_configs = [
{
targets = [ "localhost:${toString config.services.prometheus.exporters.node.port}" ];
labels = { alias = "node.server1.local"; };
}
];
}
{
job_name = "smartctl";
scrape_interval = "5s";
static_configs = [
{
targets = [ "localhost:${toString config.services.prometheus.exporters.smartctl.port}" ];
labels = { alias = "smartctl.server1.local"; };
}
];
}
];
};
}
```
I recommend setting the 5s delay to a bigger number if you have little storage as you can imagine it can generate a lot of data.
~16kB average per scrape (node-exporter). 1 day has 86400 seconds, divide that by 5 thats 17280 scrapes a day.
17280 \* 16 = 276480 kB. Thats 270 megabytes a day. And if you have multiple servers that causes X times as much.
30 days of scarping is about 8 gigabytes (1x). **But remember, by default prometheus stores data for 30 days!**
### Grafana
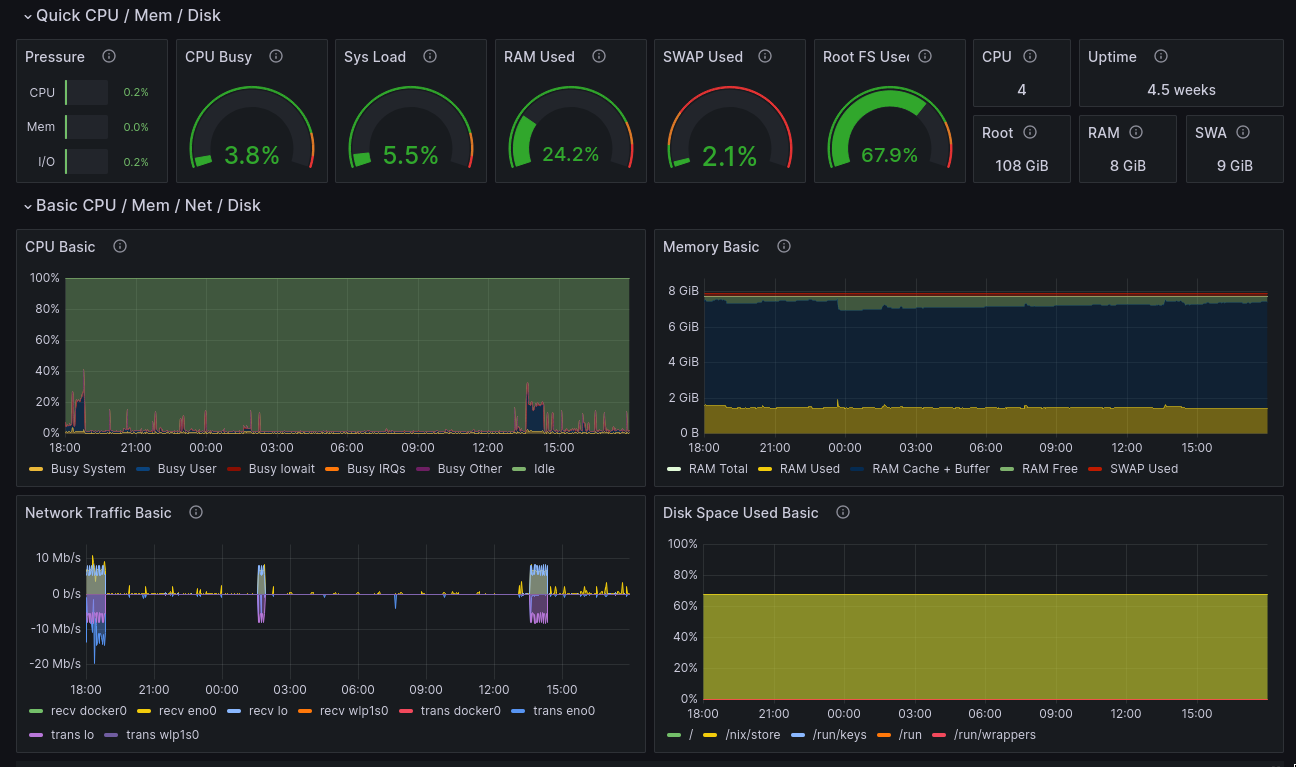
Now let's get onto gettin' a sexy dashboard like this. First we gotta setup grafana.

```nix
# /services/monitoring/grafana.nix
{ pkgs, config, ... }:
let
grafanaPort = 3000;
in
{
services.grafana = {
enable = true;
settings.server = {
http_port = grafanaPort;
http_addr = "0.0.0.0";
};
provision = {
enable = true;
datasources.settings.datasources = [
{
name = "prometheus";
type = "prometheus";
url = "http://127.0.0.1:${toString config.services.prometheus.port}";
isDefault = true;
}
];
};
};
networking.firewall = {
allowedTCPPorts = [ grafanaPort ];
allowedUDPPorts = [ grafanaPort ];
};
}
```
If you want to access it via the internet, change the following:
- `http_addr = "127.0.0.1"`
- remove the firewall allowed ports
This insures data will only flow thru the nginx reverse proxy
Remember to set `networking.domain = "example.com"` to your domain.
```nix
# /services/nginx.nix
{ pkgs, config, ... }:
let
url = "http://127.0.0.1:${toString config.services.grafana.settings.server.http_port}";
in {
services.nginx = {
enable = true;
virtualHosts = {
"grafana.${config.networking.domain}" = {
# Auto cert by let's encrypt
forceSSL = true;
enableACME = true;
locations."/" = {
proxyPass = url;
extraConfig = "proxy_set_header Host $host;";
};
locations."/api" = {
extraConfig = ''
proxy_http_version 1.1;
proxy_set_header Upgrade $http_upgrade;
proxy_set_header Connection $connection_upgrade;
proxy_set_header Host $host;
'';
proxyPass = url;
};
};
};
};
# enable 80 and 443 ports for nginx
networking.firewall = {
enable = true;
allowedTCPPorts = [
443
80
];
allowedUDPPorts = [
443
80
];
};
}
```
### Log in
The default user is `admin` and password is `admin`. Grafana will ask you to change it upon logging-in!
### Add the dashboards
For node-exporter you can go to dashboards --> new --> import --> paste in `1860`
Now you can see all the metrics of all your server(s).
## Docker-compose
{{< filetree/container >}}
{{< filetree/folder name="monitoring-project" state="closed" >}}
{{< filetree/file name="docker-compose.yml" >}}
{{< filetree/file name="prometheus.nix" >}}
{{< /filetree/folder >}}
{{< /filetree/container >}}
### Compose project
I did not include a reverse proxy, neither smartctl as I forgot how to actually do it, that's how long I've been using nix :/
```yaml
# docker-compose.yml
version: "3.8"
networks:
monitoring:
driver: bridge
volumes:
prometheus_data: {}
services:
node-exporter:
image: prom/node-exporter:latest
container_name: node-exporter
restart: unless-stopped
hostname: node-exporter
volumes:
- /proc:/host/proc:ro
- /sys:/host/sys:ro
- /:/rootfs:ro
command:
- "--path.procfs=/host/proc"
- "--path.rootfs=/rootfs"
- "--path.sysfs=/host/sys"
- "--collector.filesystem.mount-points-exclude=^/(sys|proc|dev|host|etc)($$|/)"
networks:
- monitoring
prometheus:
image: prom/prometheus:latest
container_name: prometheus
restart: unless-stopped
hostname: prometheus
volumes:
- ./prometheus.yml:/etc/prometheus/prometheus.yml
- prometheus_data:/prometheus
command:
- "--config.file=/etc/prometheus/prometheus.yml"
- "--storage.tsdb.path=/prometheus"
- "--web.console.libraries=/etc/prometheus/console_libraries"
- "--web.console.templates=/etc/prometheus/consoles"
- "--web.enable-lifecycle"
networks:
- monitoring
grafana:
image: grafana/grafana:latest
container_name: grafana
networks:
- monitoring
restart: unless-stopped
ports:
- '3000:3000'
```
```yaml
# ./prometheus.yml
global:
scrape_interval: 5s
scrape_configs:
- job_name: "node"
static_configs:
- targets: ["node-exporter:9100"]
```
```bash
docker compose up -d
```
### Setup prometheus as data source inside grafana
Head to Connections --> Data sources --> Add new data source --> Prometheus
Type in http://prometheus:9090 as the URL, on the bottom click `Save & test`.
Now you can add the dashboards, [explained in this section](#add-the-dashboards)
Photo by Chris Yang on Unsplash