11 KiB
| title | description | date | image | categories | tags | draft | writingTime | ||||||||||
|---|---|---|---|---|---|---|---|---|---|---|---|---|---|---|---|---|---|
| Monitor instances | Export metrics, collect them, visualize them. | 2024-05-17 07:00:00+0000 | chris-yang-1tnS_BVy9Jk-unsplash.jpg |
|
|
false | 20m |
Monitoring
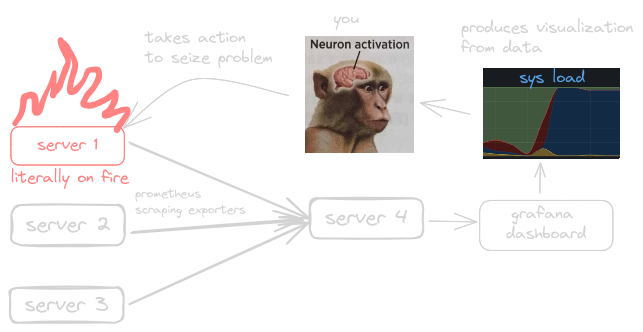
Monitoring your instances allow you to keep track of servers load and its health overtime. Even looking at the stats once a day can make a huge difference as it allows you to prevent catastrophic disasters before they even happen.
I have been monitoring my servers with this method for years and I had many cases I was grateful for setting it all up.
In this small article I have included two guides to set these services up. First is with NixOs and I also explain with docker-compose but it's very sore as the main focus of this article is NixOS.
Prometheus
Prometheus is an open-source monitoring system. It helps to track, collect, and analyze
metrics from various applications and infrastructure components. It collects metrics from other software called exporters that server a HTTP endpoint that return data in the prometheus data format.
Here is an example from node-exporter
# curl http://localhost:9100

# HELP node_cpu_seconds_total Seconds the CPUs spent in each mode.
# TYPE node_cpu_seconds_total counter
node_cpu_seconds_total{cpu="0",mode="idle"} 2.54196405e+06
node_cpu_seconds_total{cpu="0",mode="iowait"} 4213.44
node_cpu_seconds_total{cpu="0",mode="irq"} 0
node_cpu_seconds_total{cpu="0",mode="nice"} 0.06
node_cpu_seconds_total{cpu="0",mode="softirq"} 743.4
...
Grafana
Grafana is an open-source data visualization and monitoring platform. It has hundreds of features embedded that can help you query from data sources like Prometheus, InfluxDB, MySQL and so on...
NixOs
Nix makes it trivial to set up these services, as there are already predefined options for it in nixpkgs. I will give you example configuration files below that you can just copy and paste.
I have a guide on remote deployment for NixOs, below you can see an example on a folder structure you can use to deploy the services. {{< filetree/container >}}
{{< filetree/folder name="server1" state="closed" >}}
{{< filetree/folder name="services" state="closed" >}} {{< filetree/file name="some-service.nix" >}} {{< filetree/folder name="monitoring" state="closed" >}} {{< filetree/file name="prometheus.nix" >}} {{< filetree/file name="grafana.nix" >}} {{< filetree/folder name="exporters" state="closed" >}} {{< filetree/file name="node.nix" >}} {{< filetree/file name="smartctl.nix" >}} {{< /filetree/folder >}} {{< /filetree/folder >}} {{< /filetree/folder >}}
{{< filetree/file name="configuration.nix" >}} {{< filetree/file name="flake.nix" >}} {{< filetree/file name="flake.lock" >}}
{{< /filetree/folder >}}
{{< /filetree/container >}}
Exporters
First is node-exporter. It exports all kind of system metrics ranging from cpu usage, load average and even systemd service count.
Node-exporter
# /services/monitoring/exporters/node.nix
{ pkgs, ... }: {
  services.prometheus.exporters.node = {
    enable = true;
    #port = 9001; #default is 9100
    enabledCollectors = [ "systemd" ];
  };
}
Smartctl
Smartctl is a tool included in the smartmontools package. It is a collection of monitoring tools for hard-drives, SSDs and filesystems.
This exporter enables you to check up on the health of your drive(s). And it will also give you a wall notifications if one of your drives has a bad sector(s), which mainly suggests it's dying off.
# /services/monitoring/exporters/smartctl.nix
{ pkgs, ... }: {
  # exporter
  services.prometheus.exporters.smartctl = {
    enable = true;
    devices = [ "/dev/sda" ];
  };
  # for wall notifications
  services.smartd = {
    enable = true;
    notifications.wall.enable = true;
    devices = [
      {
        device = "/dev/sda";
      }
    ];
  };

}
If you happen to have other drives you can just use lsblk to check their paths
nix-shell -p util-linux --command lsblk
For example here is my pc's drives
NAME                              MAJ:MIN RM   SIZE RO TYPE  MOUNTPOINTS
sda                                 8:0    1     0B  0 disk
nvme1n1                           259:0    0 476,9G  0 disk
├─nvme1n1p1                       259:1    0   512M  0 part  /boot
├─nvme1n1p2                       259:2    0 467,6G  0 part
│ └─luks-bbb8e429-bee1-4b5e-8ce8-c54f5f4f29a2
│                                 254:0    0 467,6G  0 crypt /nix/store
│                                                            /
└─nvme1n1p3                       259:3    0   8,8G  0 part
  └─luks-f7e86dde-55a5-4306-a7c2-cf2d93c9ee0b
                                  254:1    0   8,8G  0 crypt [SWAP]
nvme0n1                           259:4    0 931,5G  0 disk  /mnt/data
Prometheus
Now that we have setup these two exporters we need to somehow collect their metrics.
Here is a config file for prometheus, with the scrape configs already written down.
# /services/monitoring/prometheus.nix
{pkgs, config, ... }:{

  services.prometheus = {
    enable = true;

    scrapeConfigs = [
      {
        job_name = "node";
        scrape_interval = "5s";
        static_configs = [
          {
            targets = [ "localhost:${toString config.services.prometheus.exporters.node.port}" ];
            labels = { alias = "node.server1.local"; };
          }
        ];
      }
      {
        job_name = "smartctl";
        scrape_interval = "5s";
        static_configs = [
          {
            targets = [ "localhost:${toString config.services.prometheus.exporters.smartctl.port}" ];
            labels = { alias = "smartctl.server1.local"; };
          }
        ];
      }
    ];
  };
}
I recommend setting the 5s delay to a bigger number if you have little storage as you can imagine it can generate a lot of data.
~16kB average per scrape (node-exporter). 1 day has 86400 seconds, divide that by 5 thats 17280 scrapes a day.
17280 * 16 = 276480 kB. Thats 270 megabytes a day. And if you have multiple servers that causes X times as much.
30 days of scarping is about 8 gigabytes (1x). But remember, by default prometheus stores data for 30 days!
Grafana
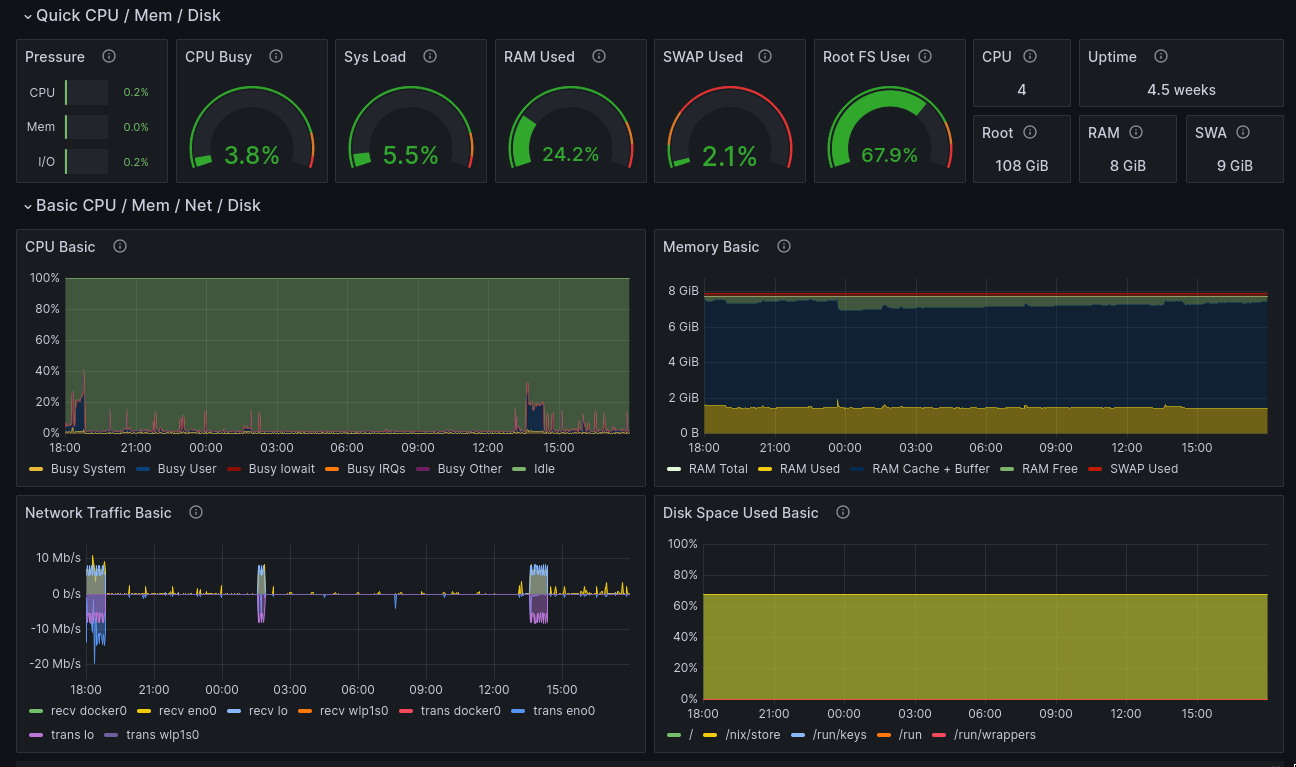
Now let's get onto gettin' a sexy dashboard like this. First we gotta setup grafana.
# /services/monitoring/grafana.nix
{ pkgs, config, ... }:
let
  grafanaPort = 3000;
in
{
  services.grafana = {
    enable = true;
    settings.server = {
      http_port = grafanaPort;
      http_addr = "0.0.0.0";
    };
    provision = {
      enable = true;
      datasources.settings.datasources = [
        {
          name = "prometheus";
          type = "prometheus";
          url = "http://127.0.0.1:${toString config.services.prometheus.port}";
          isDefault = true;
        }
      ];
    };
  };

  networking.firewall = {
    allowedTCPPorts = [ grafanaPort ];
    allowedUDPPorts = [ grafanaPort ];
  };
}
If you want to access it via the internet, change the following:
http_addr = "127.0.0.1"- remove the firewall allowed ports
This insures data will only flow thru the nginx reverse proxy
Remember to set networking.domain = "example.com" to your domain.
# /services/nginx.nix
{ pkgs, config, ... }:
let
  url = "http://127.0.0.1:${toString config.services.grafana.settings.server.http_port}";
in {
  services.nginx = {
    enable = true;

    virtualHosts = {
      "grafana.${config.networking.domain}" = {
        # Auto cert by let's encrypt
        forceSSL = true;
        enableACME = true;

        locations."/" = {
          proxyPass = url;
          extraConfig = "proxy_set_header Host $host;";
        };

        locations."/api" = {
          extraConfig = ''
            proxy_http_version 1.1;
            proxy_set_header Upgrade $http_upgrade;
            proxy_set_header Connection $connection_upgrade;
            proxy_set_header Host $host;
          '';
          proxyPass = url;
        };
      };
    };
  };

  # enable 80 and 443 ports for nginx
  networking.firewall = {
    enable = true;
    allowedTCPPorts = [
      443
      80
    ];
    allowedUDPPorts = [
      443
      80
    ];
  };
}
Log in
The default user is admin and password is admin. Grafana will ask you to change it upon logging-in!
Add the dashboards
For node-exporter you can go to dashboards --> new --> import --> paste in 1860
Now you can see all the metrics of all your server(s).
Docker-compose
{{< filetree/container >}}
{{< filetree/folder name="monitoring-project" state="closed" >}}
{{< filetree/file name="docker-compose.yml" >}} {{< filetree/file name="prometheus.nix" >}}
{{< /filetree/folder >}}
{{< /filetree/container >}}
Compose project
I did not include a reverse proxy, neither smartctl as I forgot how to actually do it, that's how long I've been using nix :/
# docker-compose.yml
version: "3.8"

networks:
  monitoring:
    driver: bridge

volumes:
  prometheus_data: {}

services:
  node-exporter:
    image: prom/node-exporter:latest
    container_name: node-exporter
    restart: unless-stopped
    hostname: node-exporter
    volumes:
      - /proc:/host/proc:ro
      - /sys:/host/sys:ro
      - /:/rootfs:ro
    command:
      - "--path.procfs=/host/proc"
      - "--path.rootfs=/rootfs"
      - "--path.sysfs=/host/sys"
      - "--collector.filesystem.mount-points-exclude=^/(sys|proc|dev|host|etc)($$|/)"
    networks:
      - monitoring

  prometheus:
    image: prom/prometheus:latest
    container_name: prometheus
    restart: unless-stopped
    hostname: prometheus
    volumes:
      - ./prometheus.yml:/etc/prometheus/prometheus.yml
      - prometheus_data:/prometheus
    command:
      - "--config.file=/etc/prometheus/prometheus.yml"
      - "--storage.tsdb.path=/prometheus"
      - "--web.console.libraries=/etc/prometheus/console_libraries"
      - "--web.console.templates=/etc/prometheus/consoles"
      - "--web.enable-lifecycle"
    networks:
      - monitoring

 grafana:
    image: grafana/grafana:latest
    container_name: grafana
    networks:
      - monitoring
    restart: unless-stopped
    ports:
     - '3000:3000'
# ./prometheus.yml
global:
  scrape_interval: 5s

scrape_configs:
  - job_name: "node"
    static_configs:
      - targets: ["node-exporter:9100"]
docker compose up -d
Setup prometheus as data source inside grafana
Head to Connections --> Data sources --> Add new data source --> Prometheus
Type in http://prometheus:9090 as the URL, on the bottom click Save & test.
Now you can add the dashboards, explained in this section
Photo by Chris Yang on Unsplash

