1.8 KiB
1.8 KiB
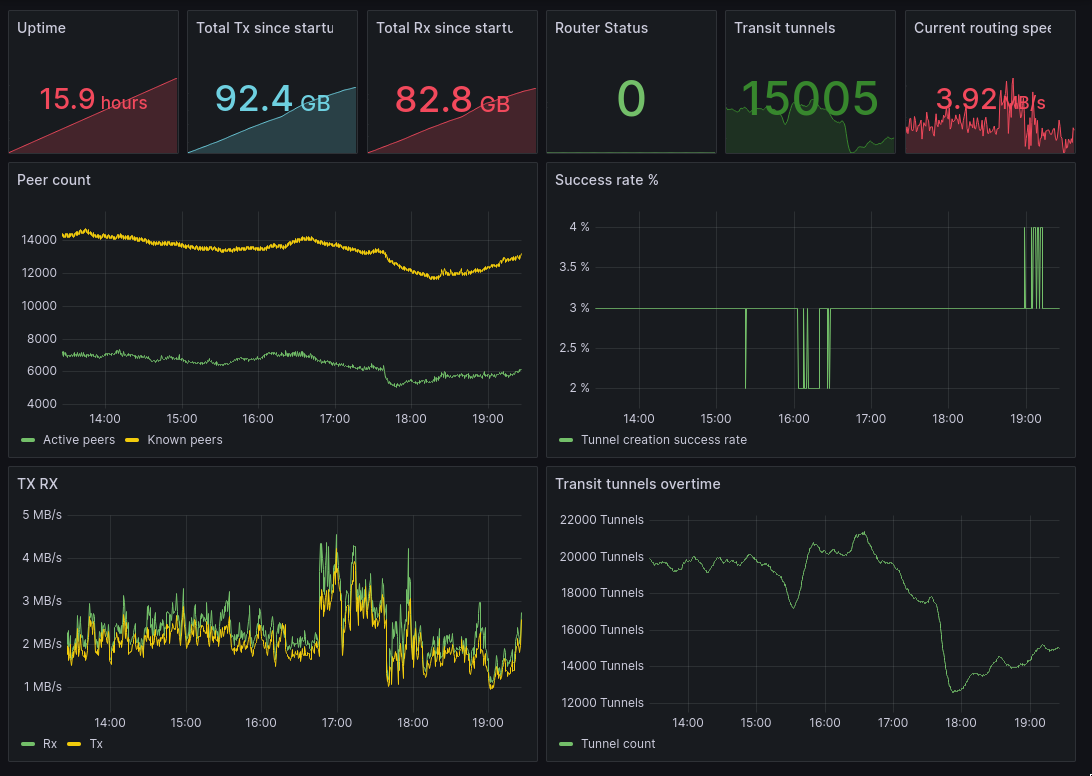
I2PD exporter
A basic prometheus exporter that exports miscellaneous data using the i2pcontrol protocol such as peers, data sent & received and so on...
How to use (Nix)
- Import to your flake
{
  description = "A simple NixOS flake";

  inputs = {
    nixpkgs.url = "github:NixOS/nixpkgs/nixos-23.11";
    i2pd-exporter = {
        url = "git+https://git.4o1x5.dev/4o1x5/i2pd-exporter";
      inputs.nixpkgs.follows = "nixpkgs";
    };

  };

  outputs =
    { self
    , nixpkgs
    , i2pd-exporter
    , ...
    }:
    let
      system = "x86_64-linux";
    in
    {
      nixosConfigurations.server = nixpkgs.lib.nixosSystem
        {
          inherit system;
          modules = [
            ./configuration.nix

            i2pd-exporter.nixosModules.default
          ];
        };
    };
}
- Enable I2PControl for I2PD
{pkgs, ...}:{

  services.i2pd = {
    enable = true;
    proto.i2pControl = {
        enable = true;
        port = 7659;
        name = "i2pcontrol";
        address = "127.0.0.1";
    };
  };
}
- Enable the exporter
{pkgs, config, ...}:{
  services.prometheus.exporters.i2pd = {
    enable = true;
    port = 3321;
    openFirewall = true;
    routerAddress = "https://127.0.0.1:${toString config.services.i2pd.proto.i2pControl.port}";
    routerPassword = "itoopie";
  };
}
- Scrape via prometheus
{ pkgs, config, ... }: {

  services.prometheus = {
    enable = true;

    scrapeConfigs = [
      {
        job_name = "i2p";
        scrape_interval = "5s";
        static_configs = [
          {
            targets = [ "localhost:${toString config.services.prometheus.exporters.i2pd.port}" ];
            labels = { alias = "i2pd.server.local"; };
          }
        ];
      }
    ];
  }
}
- Import the grafana dashboard
todo
Docker
docker compose up -d